Expoloring the data from the CliRes database
Packages
Installing the required packages:
> required <- c("dplyr", "magrittr", "readr")
> to_install <- setdiff(required, row.names(installed.packages()))
> if (length(to_install)) install.packages(to_install)
Loading magrittr:
> library(magrittr)Loading the data
> viparc <- readr::read_csv("https://raw.githubusercontent.com/viparc/clires_data/master/data/viparc.csv",
+                           col_types = paste(c("cii", rep("l", 6), rep("d", 45), "lil"), collapse = ""))
Numbers of farms, flocks and weeks
There are 114 farms in the study:
> length(unique(viparc$farm))
[1] 114
And a total of 315 flocks:
> viparc %>%
+   dplyr::select(farm, flock) %>%
+   unique() %>%
+   nrow()
[1] 315
Of which there are 287 completed flocks :
> viparc %>%
+   dplyr::filter(completed) %>%
+   dplyr::select(farm, flock) %>%
+   unique() %>%
+   nrow()
[1] 287
This represents 5391 weeks of observation:
> nrow(viparc)
[1] 5391
And 5103 weeks for completed flocks:
> nrow(dplyr::filter(viparc, completed))
[1] 5103
The distribution of the number of flocks per farm:
> viparc %>%
+   dplyr::select(farm, flock) %>%
+   unique() %>%
+   dplyr::group_by(farm) %>%
+   dplyr::tally() %>%
+   dplyr::ungroup() %$%
+   hist(n, 0:12, col = "grey", main = NA, xlab = "number of flocks", ylab = "number of farms")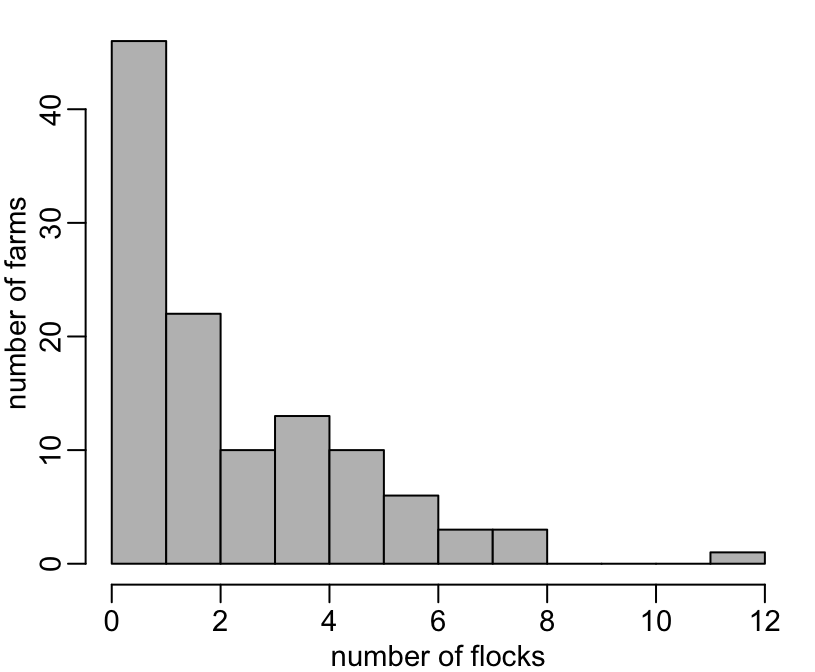
or:
> viparc %>%
+   dplyr::select(farm, flock) %>%
+   unique() %>%
+   dplyr::group_by(farm) %>%
+   dplyr::tally() %>%
+   dplyr::ungroup() %$%
+   table(n)
n
 1  2  3  4  5  6  7  8 12
46 22 10 13 10  6  3  3  1
The same thing, considering only completed flocks:
> viparc %>%
+   dplyr::filter(completed) %>%
+   dplyr::select(farm, flock) %>%
+   unique() %>%
+   dplyr::group_by(farm) %>%
+   dplyr::tally() %>%
+   dplyr::ungroup() %$%
+   hist(n, 0:12, col = "grey", main = NA, xlab = "number of completed flocks", ylab = "number of farms")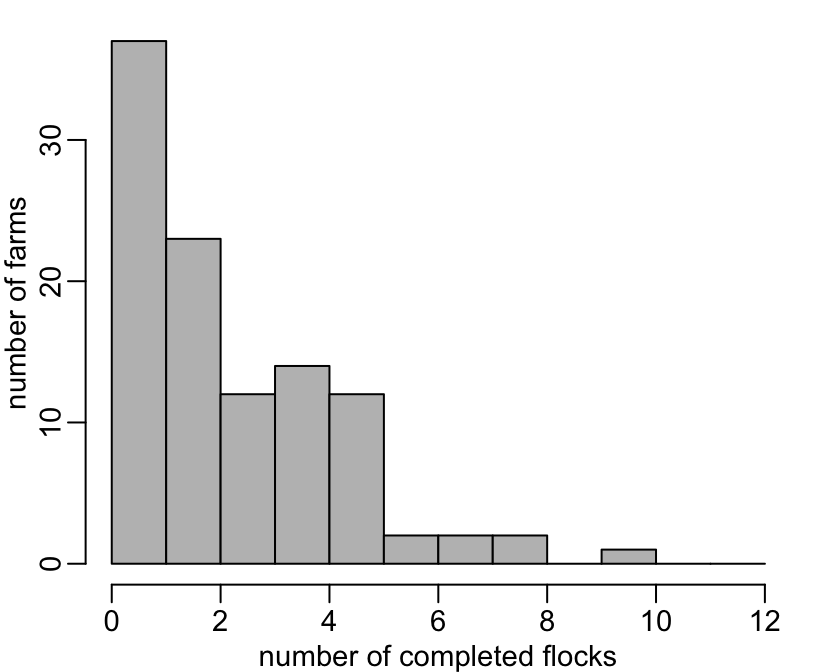
or:
> viparc %>%
+   dplyr::filter(completed) %>%
+   dplyr::select(farm, flock) %>%
+   unique() %>%
+   dplyr::group_by(farm) %>%
+   dplyr::tally() %>%
+   dplyr::ungroup() %$%
+   table(n)
n
 1  2  3  4  5  6  7  8 10
37 23 12 14 12  2  2  2  1
The distribution of the number of weeks per flock:
> viparc %>%
+   dplyr::group_by(farm, flock) %>%
+   dplyr::tally() %>%
+   dplyr::ungroup() %$%
+   hist(n, 0:27, col = "grey", main = NA, xlab = "number of weeks", ylab = "number of flocks")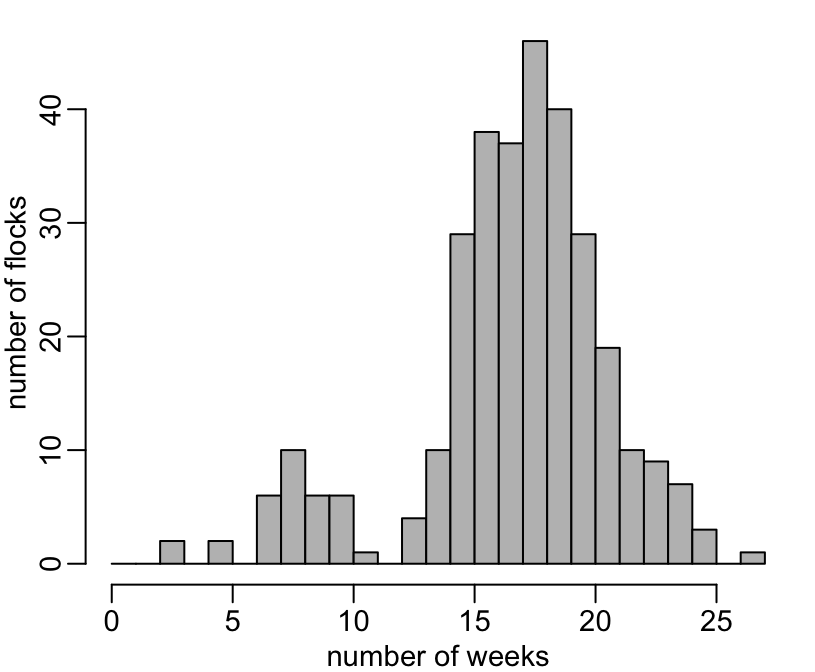
> viparc %>%
+   dplyr::group_by(farm, flock) %>%
+   dplyr::tally() %>%
+   dplyr::ungroup() %$%
+   table(n)
n
 3  5  7  8  9 10 11 13 14 15 16 17 18 19 20 21 22 23 24 25 27
 2  2  6 10  6  6  1  4 10 29 38 37 46 40 29 19 10  9  7  3  1
The same thing, considering only the completed flocks:
> viparc %>%
+   dplyr::filter(completed) %>%
+   dplyr::group_by(farm, flock) %>%
+   dplyr::tally() %>%
+   dplyr::ungroup() %$%
+   hist(n, 0:27, col = "grey", main = NA, xlab = "number of weeks", ylab = "number of flocks")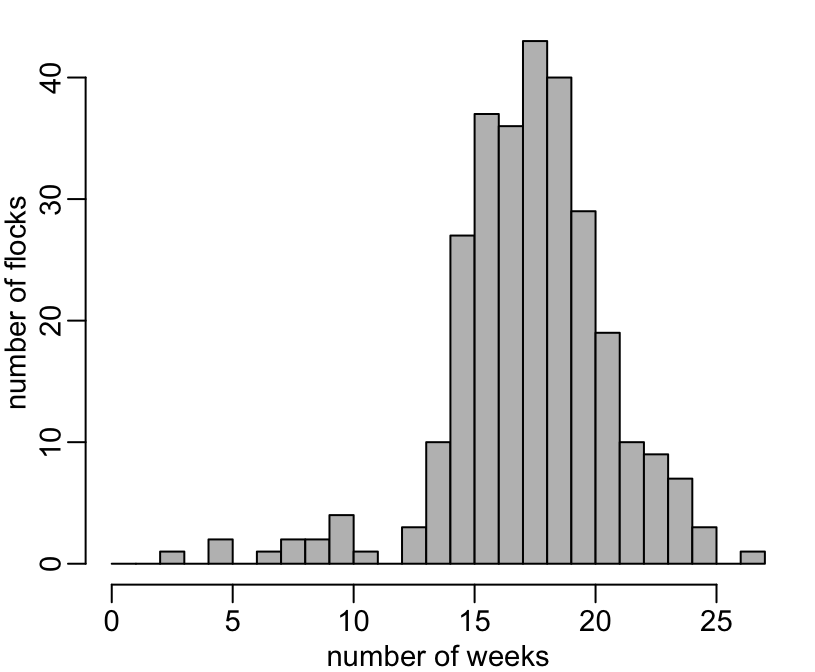
> viparc %>%
+   dplyr::filter(completed) %>%
+   dplyr::group_by(farm, flock) %>%
+   dplyr::tally() %>%
+   dplyr::ungroup() %$%
+   table(n)
n
 3  5  7  8  9 10 11 13 14 15 16 17 18 19 20 21 22 23 24 25 27
 1  2  1  2  2  4  1  3 10 27 37 36 43 40 29 19 10  9  7  3  1
Number of chicken
The distribution of the flocks sizes:
> viparc %>%
+   dplyr::filter(week < 2) %$%
+   hist(nb_chicken, nclass = 30, col = "grey", main = NA, xlab = "number of chicken", ylab = "number of flocks")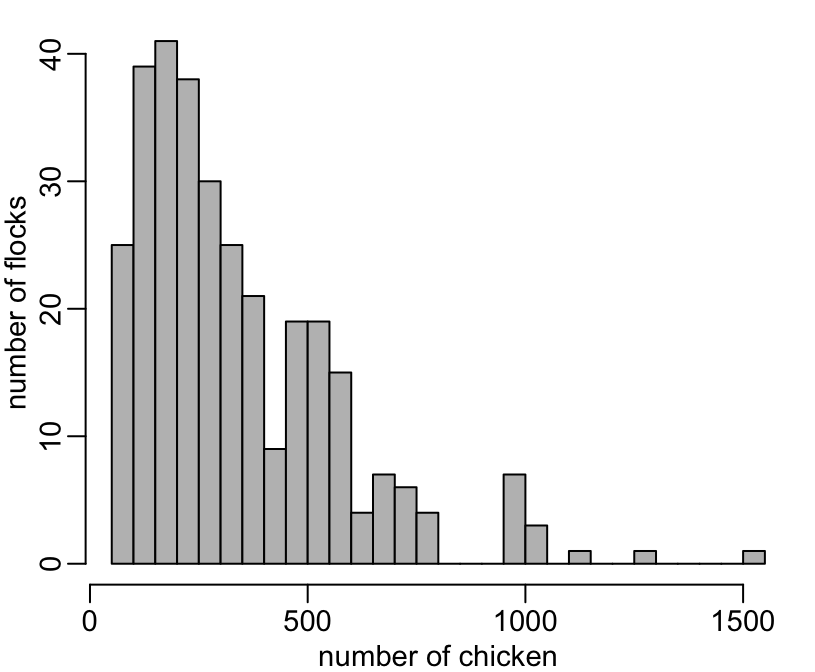
Or:
> viparc %>%
+   dplyr::filter(week < 2) %$%
+   head(sort(nb_chicken), 15)
 [1]  50  72  93  96  96  97  97  97  98  98  99  99 100 100 100
The distribution of the farms sizes:
> viparc %>%
+   dplyr::filter(week < 2) %>%
+   dplyr::group_by(farm) %>%
+   dplyr::summarise(size = mean(nb_chicken)) %>%
+   dplyr::ungroup() %$%
+   hist(size, col = "grey", main = NA, xlab = "number of chicken", ylab = "number of farms")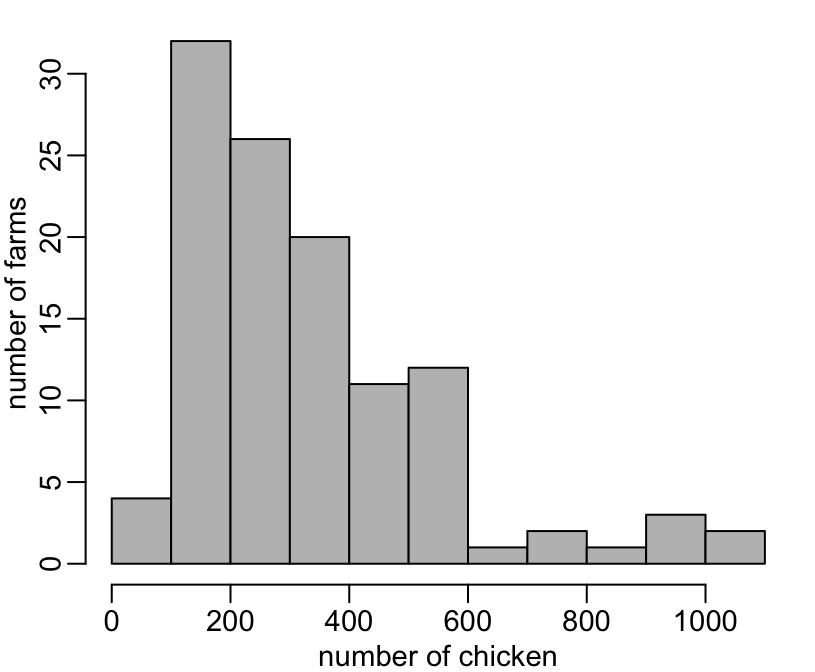
Or:
> viparc %>%
+   dplyr::filter(week < 2) %>%
+   dplyr::group_by(farm) %>%
+   dplyr::summarise(size = mean(nb_chicken)) %>%
+   dplyr::ungroup() %$%
+   head(round(sort(size)), 15)
 [1]  72  83  98 100 101 101 102 102 108 112 122 124 126 139 145
Feces samplings
Not all the flocks are sampled 3 times:
> (samplings <- viparc %>%
+   dplyr::select(farm, flock, completed, sampling) %>%
+   dplyr::group_by(farm, flock) %>%
+   dplyr::summarise(completed = mean(completed), sampling = sum(sampling, na.rm = TRUE)) %>%
+   dplyr::ungroup() %>%
+   dplyr::mutate(completed = completed > 0))
# A tibble: 315 x 4
   farm   flock completed sampling
   <chr>  <int> <lgl>        <int>
 1 75-001     1 TRUE             3
 2 75-001     2 TRUE             3
 3 75-001     3 TRUE             3
 4 75-001     4 TRUE             3
 5 75-001     5 TRUE             3
 6 75-001     6 TRUE             3
 7 75-002     1 TRUE             3
 8 75-002     2 TRUE             3
 9 75-002     3 TRUE             3
10 75-002     4 TRUE             3
# … with 305 more rows
> with(samplings, table(completed, sampling))
sampling
completed 0 1 2 3
FALSE 0 6 17 5
TRUE 3 7 21 255The reasons for less than 3 samplings seems to be
- the flock is uncomplete
- the flock died prematuraly
- some samplings were missed
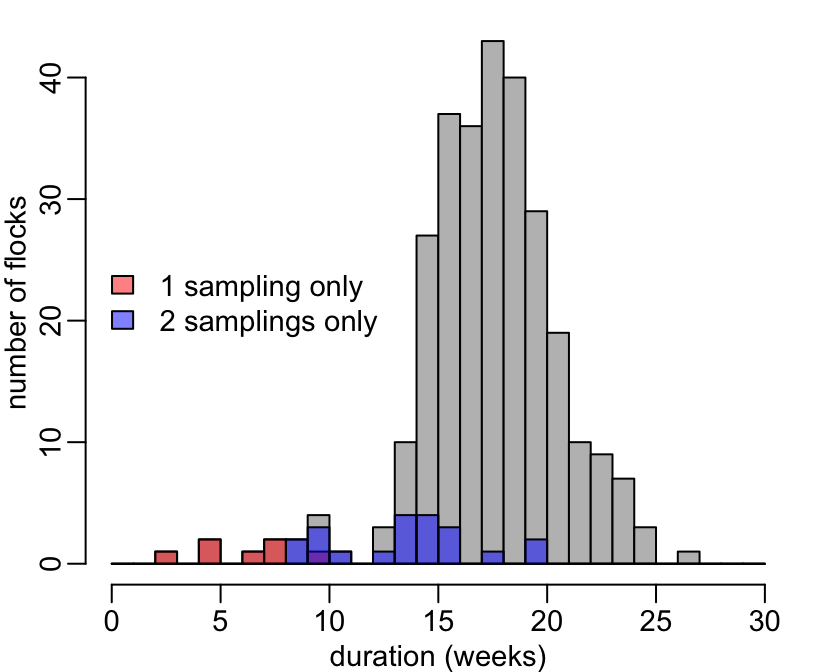
Let’s explore a bit more by focusing on the completed flocks and see whether the flocks with less than 3 samplings tend to be short ones (i.e. suggesting premature death of the flock):
> hist2 <- function(x, ...) hist(x, breaks = 0:30, ...)
>
> # Let's plot the durations of the completed flocks:
>
> viparc %>%
+   dplyr::filter(completed) %>%
+   dplyr::group_by(farm, flock) %>%
+   dplyr::tally() %>%
+   dplyr::ungroup() %$%
+   hist2(n, col = "grey", xlab = "duration (weeks)", ylab = "number of flocks", main = NA)
>
> # Let's now plot the durations of the completed flocks with 1 sample only:
>
> samplings %>%
+   dplyr::filter(completed, sampling == 1) %$%
+   purrr::map2(farm, flock, function(x, y) nrow(dplyr::filter(viparc, farm == x, flock == y))) %>%
+   unlist() %>%
+   hist2(col = adjustcolor("red", .5), add = TRUE)
>
> # And the durations of the completed flocks with 2 samples only:
>
> samplings %>%
+   dplyr::filter(completed, sampling == 2) %$%
+   purrr::map2(farm, flock, function(x, y) nrow(dplyr::filter(viparc, farm == x, flock == y))) %>%
+   unlist() %>%
+   hist2(col = adjustcolor("blue", .5), add = TRUE)
>
> legend("left", c("1 sampling only", "2 samplings only"), fill = adjustcolor(c("red", "blue"), .5), bty = "n")